
The Singapore Department of Statistics recently released its 2021 SME statistics. The data is showing a positive change for Singapore SMEs. Let us explore.
Overview of SMEs in Singapore
We see an increase in the total number of enterprises from 273,100 in 2019 to 291,600 in 2021. Of that, SMEs make up 99% of all enterprises and support 71% of total employment. 80% of SMEs are locally owned, whilst 20% are foreign-owned. Interestingly, with a larger number of enterprises, we see a slight drop in employment from 3.52 million in 2019 to 3.4 million in 2021. This could be due to the border closure brought about by the recent COVID-19 pandemic.
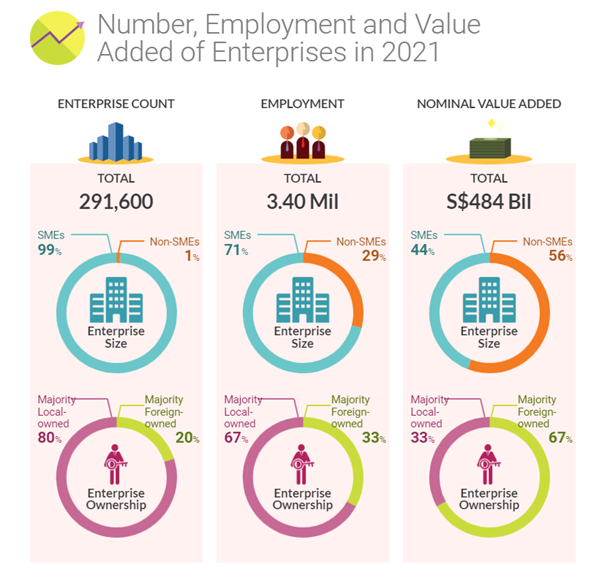

*Small and Medium Enterprises (SMEs) are defined as companies with a turnover of less than S$100 million or employ 200 or fewer employees.
Singapore GDP
In 2021, Singapore’s overall GDP was S$533,352 million, an increase of 13.5% compared to the previous year (S$469,096 million). Both import and export price indexes increased by around 11%.
The top Import Price Index
- Mineral fuels & related materials, 58.5%
- Animal & vegetable oils, 45.1%
- Manufactured goods, 10.1%
The top Export Price index
- Mineral fuels & related materials, 54.3%
- Crude materials, 22.1%
- Animal & vegetable oils, 17.2%
* Import and export price indexes measure the change in prices of goods and services purchased from abroad by Singapore consumers and businesses (imports) and sold to foreign buyers (exports).
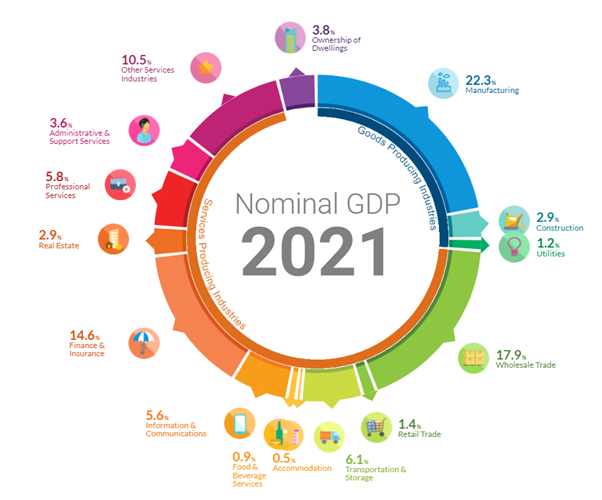
Almost 75% of the GDP nominal value added was generated by the service industries and 25% was generated by the goods-producing industries.
The top 3 services industries are:
- 9%, Wholesale trade
- 6%, Finance, and insurance
- 8%, Other service industries
The top 3 goods-producing industries are:
- 3%, Manufacturing
- 9%, Construction
- 2% Utilities
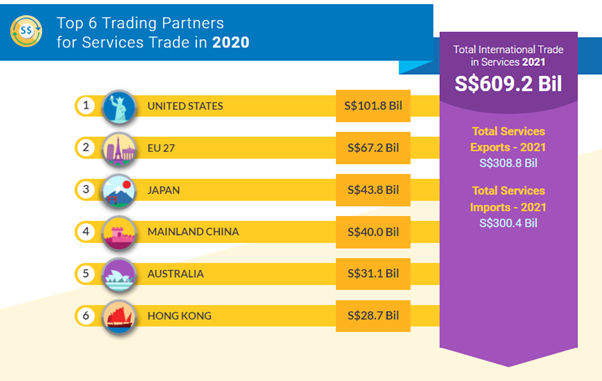
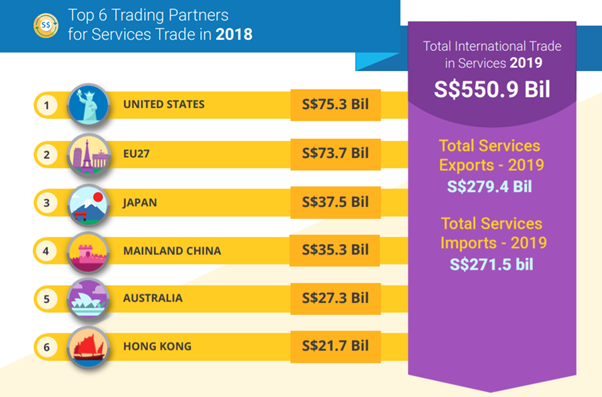
In 2020, Singapore SMEs exported services internationally worth over S$609 billion. The top 6 trading partners are the United States (~17%), EU 27 (~11%), Japan (~7%), China (~7%), Australia (~5%), and Hong Kong (~4%). Interestingly, there is an increase in trading with the US. It went up from S$75.3 billion to S$101.8 billion. However, the traded value for all the other top 5 countries declined in 2020 compared to 2018.
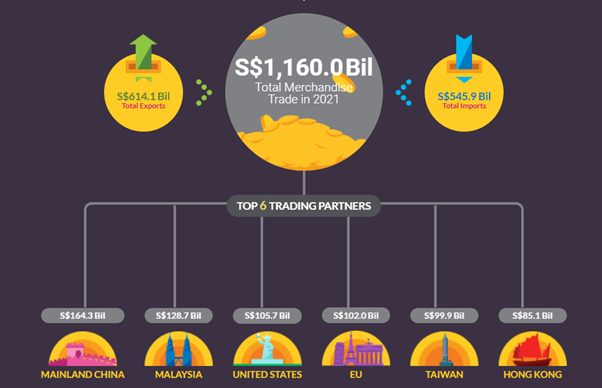
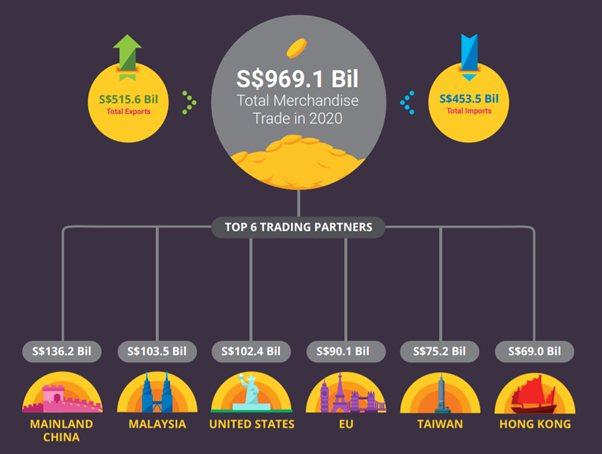
Total merchandise trade in 2021 was S$1,160 billion, exporting S$515.6 billion and importing S$453.5 billion. There was no change in the top 6 trading partners per 2020 data:
- China, S$164.3 billion (14%)
- Malaysia, S$128.7 billion (11%)
- United States, S$105.7 billion (10%)
- EU, S$102 billion (9%)
- Taiwan, S$99.9 billion (8%)
- Hong Kong, S$85.1 billion (7%)
Others interesting statistics
Other facts worth noting:
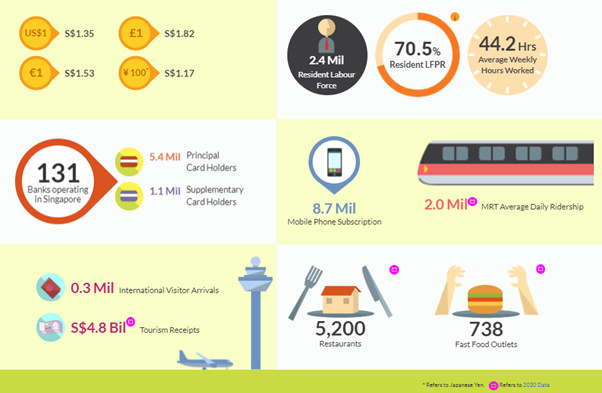
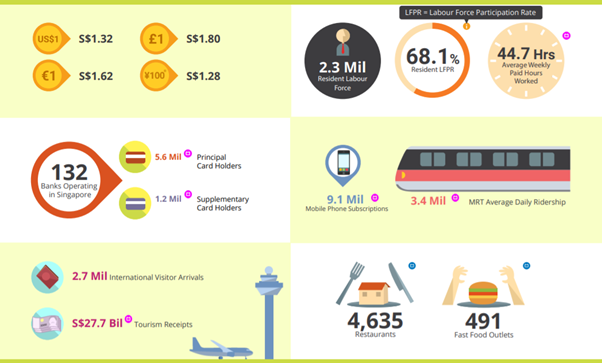
- Tourism spending in Singapore plunged from S$27.7 billion in 2020 to S$4.8 billion in 2021
- The number of restaurants and fast-food outlets increased in 2021
- Fewer people are using the MRT in 2021, with 2 million average daily ridership in 2021 compared to 3.4 million in 2020
2021 other statistics
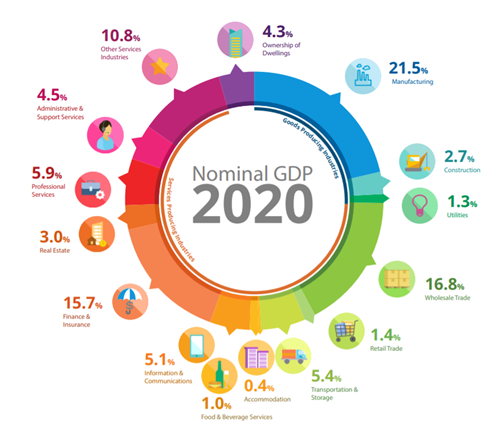
2020 other statistics

Singapore Businesses Remain Positive Outlook for 2024

Unveiling the Atradius Payment Barometer 2023: Downbeat Exports Outlook Poses Challenge for B2B Trading on Credit
